


A Look at Boston VC in 2019
The State of Venture in Boston by the Numbers

Welcome to the New Year!
As we close out the decade and re-enter the Roaring Twenties, I wanted to take some time to reflect upon the many developments in Boston’s tech VC ecosystem instead of my usual weekly updates. Don’t worry, I’ll save my year-end ambiguous 2020 tech predictions and humble brag achievements for twitter. With that said, I did put together a collection of pieces by others that I think sum up the state of venture in 2019 and set the pace for 2020. You can find it here.
The following post is a summary of investment data on the Boston venture ecosystem compiled from Pitchbook. It highlights some trends in total capital invested, active players in the ecosystem, industry trends, and more.
If you’re reading this for the first time, welcome! My name is Nick Stuart and I write a weekly newsletter on tech VC financing trends in Boston. You can learn more about me on my website here and about the micro-VC I help run here.
*The Data:
This is all raw deal data from Pitchbook, search parameters outlined at the bottom of this newsletter.
As everyone uses different sources/classifications for these deals, consider reading some other fantastic updates on the Boston venture space to broaden your view: NEVCA’s Year in Review, Underscore: A Strong 2019 for Boston Startups, Pillar.VC Year in Review, and Bostinno: Most Significant M&A Deals of 2019 & Most Notable Funding Rounds of 2019. Let me know if there are any I missed.
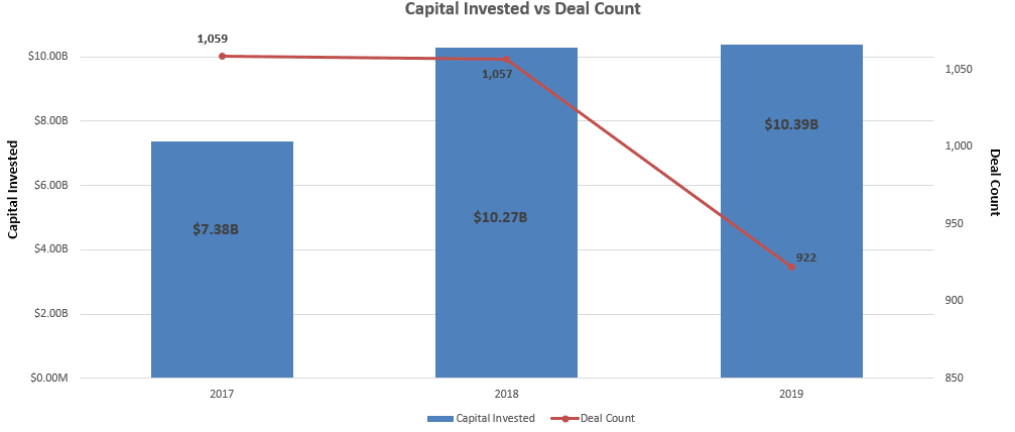
💸 $10.4B in venture capital flowed into 783 Boston companies in 2019.
How does this compare year over year? Pretty well. In terms of capital invested, Boston brought in an additional $800M compared to 2018 and is up almost $3B from 2017. Deal count has taken a small dip as the national trend of fewer companies raising more capital continues.
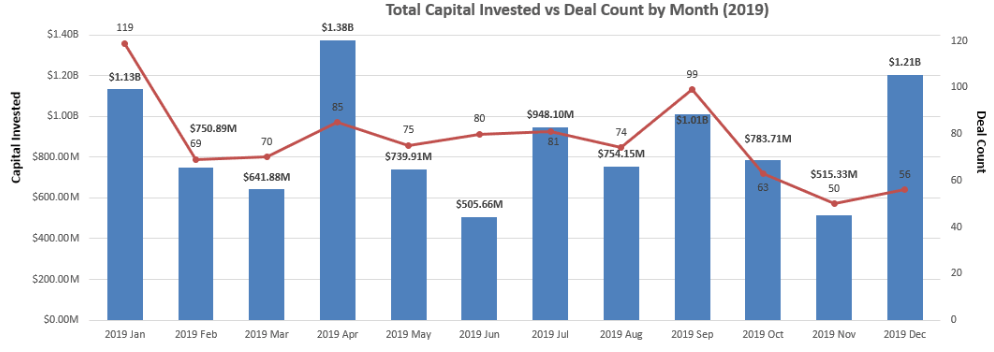
These 783 companies secured funding primarily from Early Stage and Later Stage investors, representing 922 deals in total. January, April, and December all managed to crack $1B of funding in under a month.
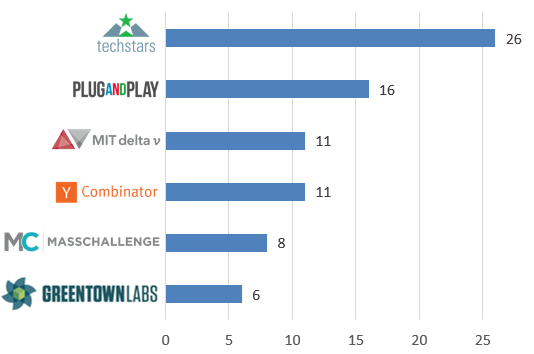
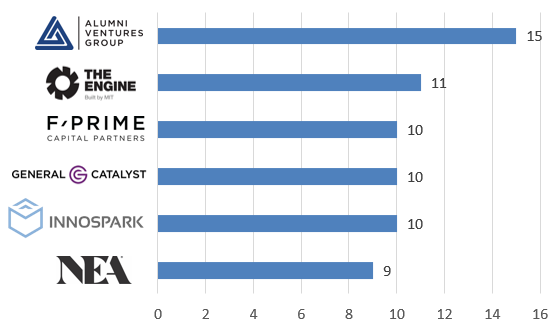
💨Techstars, Launchpad, and AVG were among the most active firms investing in Boston-based startups by deal count.
I took a look at deals by investor type to get a better idea of who the top 5-6 investors are in the categories of Accelerator/Incubators, Angel Groups, and VC funds.
These graphs represent the Boston-based startup investment deal count for each of these firms in 2019.
Of the 17 investors listed, ten are headquartered within Boston.
Most Active Accelerators and Incubators:
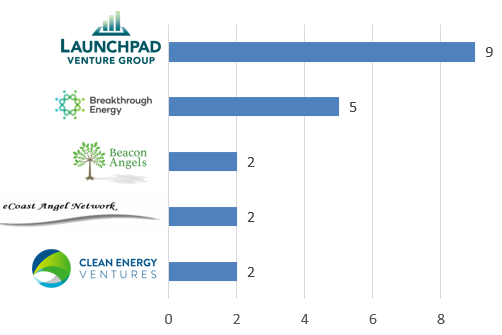
Most Active Angel Groups:
Most Active VCs:
💰 Last year, eighteen Boston companies raised “megarounds” that were in excess of $100M.
The 18 ten most-funded Boston companies in 2019 together raised ~$2.7B, with the majority being tech ventures.

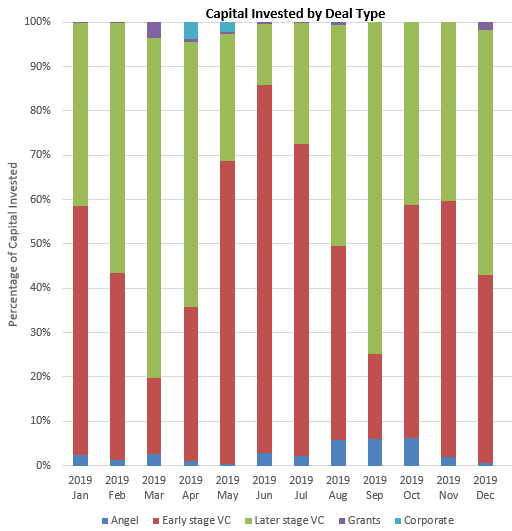
👼 Early Stage and Later Stage VC accounted for the majority of total capital invested, but Angel deals were a almost a third of total deal count.
Early Stage and Later Stage VC accounted for the majority of capital invested in Boston companies for 2019 at a combined 96% (pictured below by month).
However, by deal count, angel investments accounted for 23% of Boston’s 2019 venture deals. Essentially Series A deals and beyond represented 70% of all deals and 96% of total invested capital.

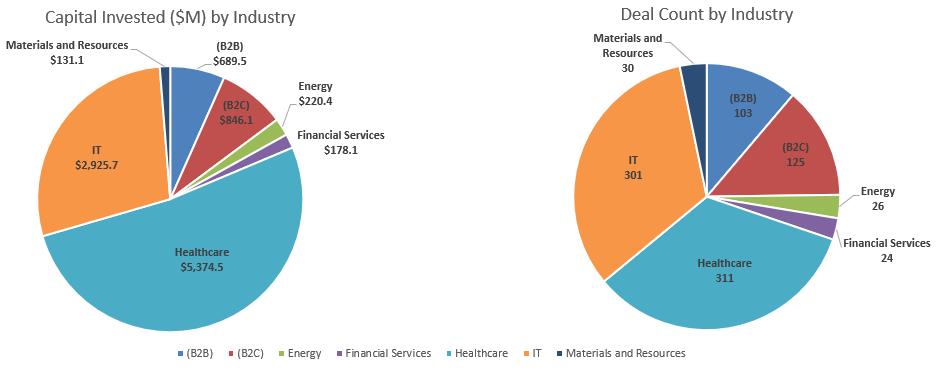
🏥 Healthcare companies accounted for a third of all deals and half of all capital invested.
This probably doesn’t surprise anybody, but it does show that Boston continues to grow as an outlet for technology ventures and not just biotech/life science. Not to mention that the biggest exits in Boston have actually been consumer, technology-enabled businesses.
Healthcare companies raised $5.4B spanning across over 300 deals. Information Technology closely matched healthcare with 33% of deals, but just 28% of total capital invested at $2.9B.
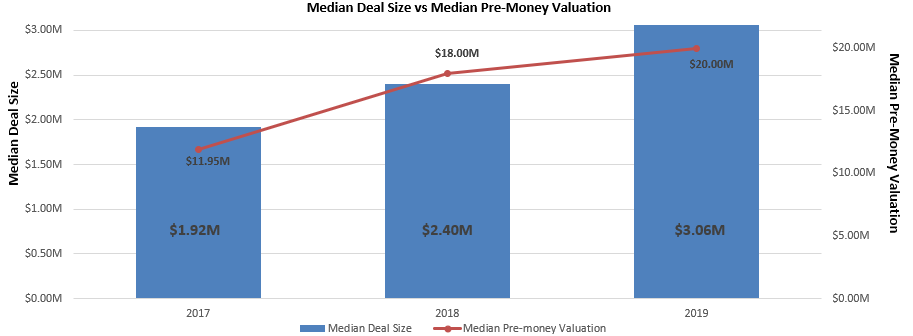
📈 In 2019, the median deal size for venture backed companies in Boston was $3M and the median pre-money valuation was $20M
This investment size was fairly consistent across all of 2019, spare for October and December, which saw median deal sizes double to $6M.
Since 2017, pre-money valuations have also steadily risen from a median of ~$12M in 2017 to $20M at the end of 2019.
Thank You!
Thank you to all of you who have subscribed and shared my newsletter over the past few months. Writing more often was my resolution from 2018, so I’m happy that I managed to at least start doing it more in the last two months of the year.
As we move into 2020, I’d love to hear what you think of the newsletter so far. What could be improved? What would you like to see more/less of? Shoot me an email or twitter DM and tell me your thoughts!
*The Data:
Search Criteria: Deal Date: From: 01-Jan-2019; To: 31-Dec-2019; Deal Option: Search on a full transaction; Deal Types: All VC Stages; All Round Numbers; All Series; Ownership Status: Privately Held (backing); Backing Status: Accelerator/Incubator-backed; Angel-backed; VC-backed; Corporate-backed/Acquired; Other Statuses > Formerly Backed; Location: United States > New England > Massachusetts; Search HQ Only;
Thank you Pitchbook!
Missing something? Spot an inaccuracy?
Email me and tell me about it! I’ll be sure to share it in my next update and edit it on the website.